
[Infographic] Overview of WASSCE Results 2015
 At the Senior High School level in Ghana, students write the West African Senior School Certificate Examination(WASSCE) before moving to the universities. WAEC has released the results for this year’s WASSCE including some astonishing statistics about the examinations.The irregularities resulting from some examinations malpractices are alarming. That will be our focus today as we compare this year’s statistics to that of last year.
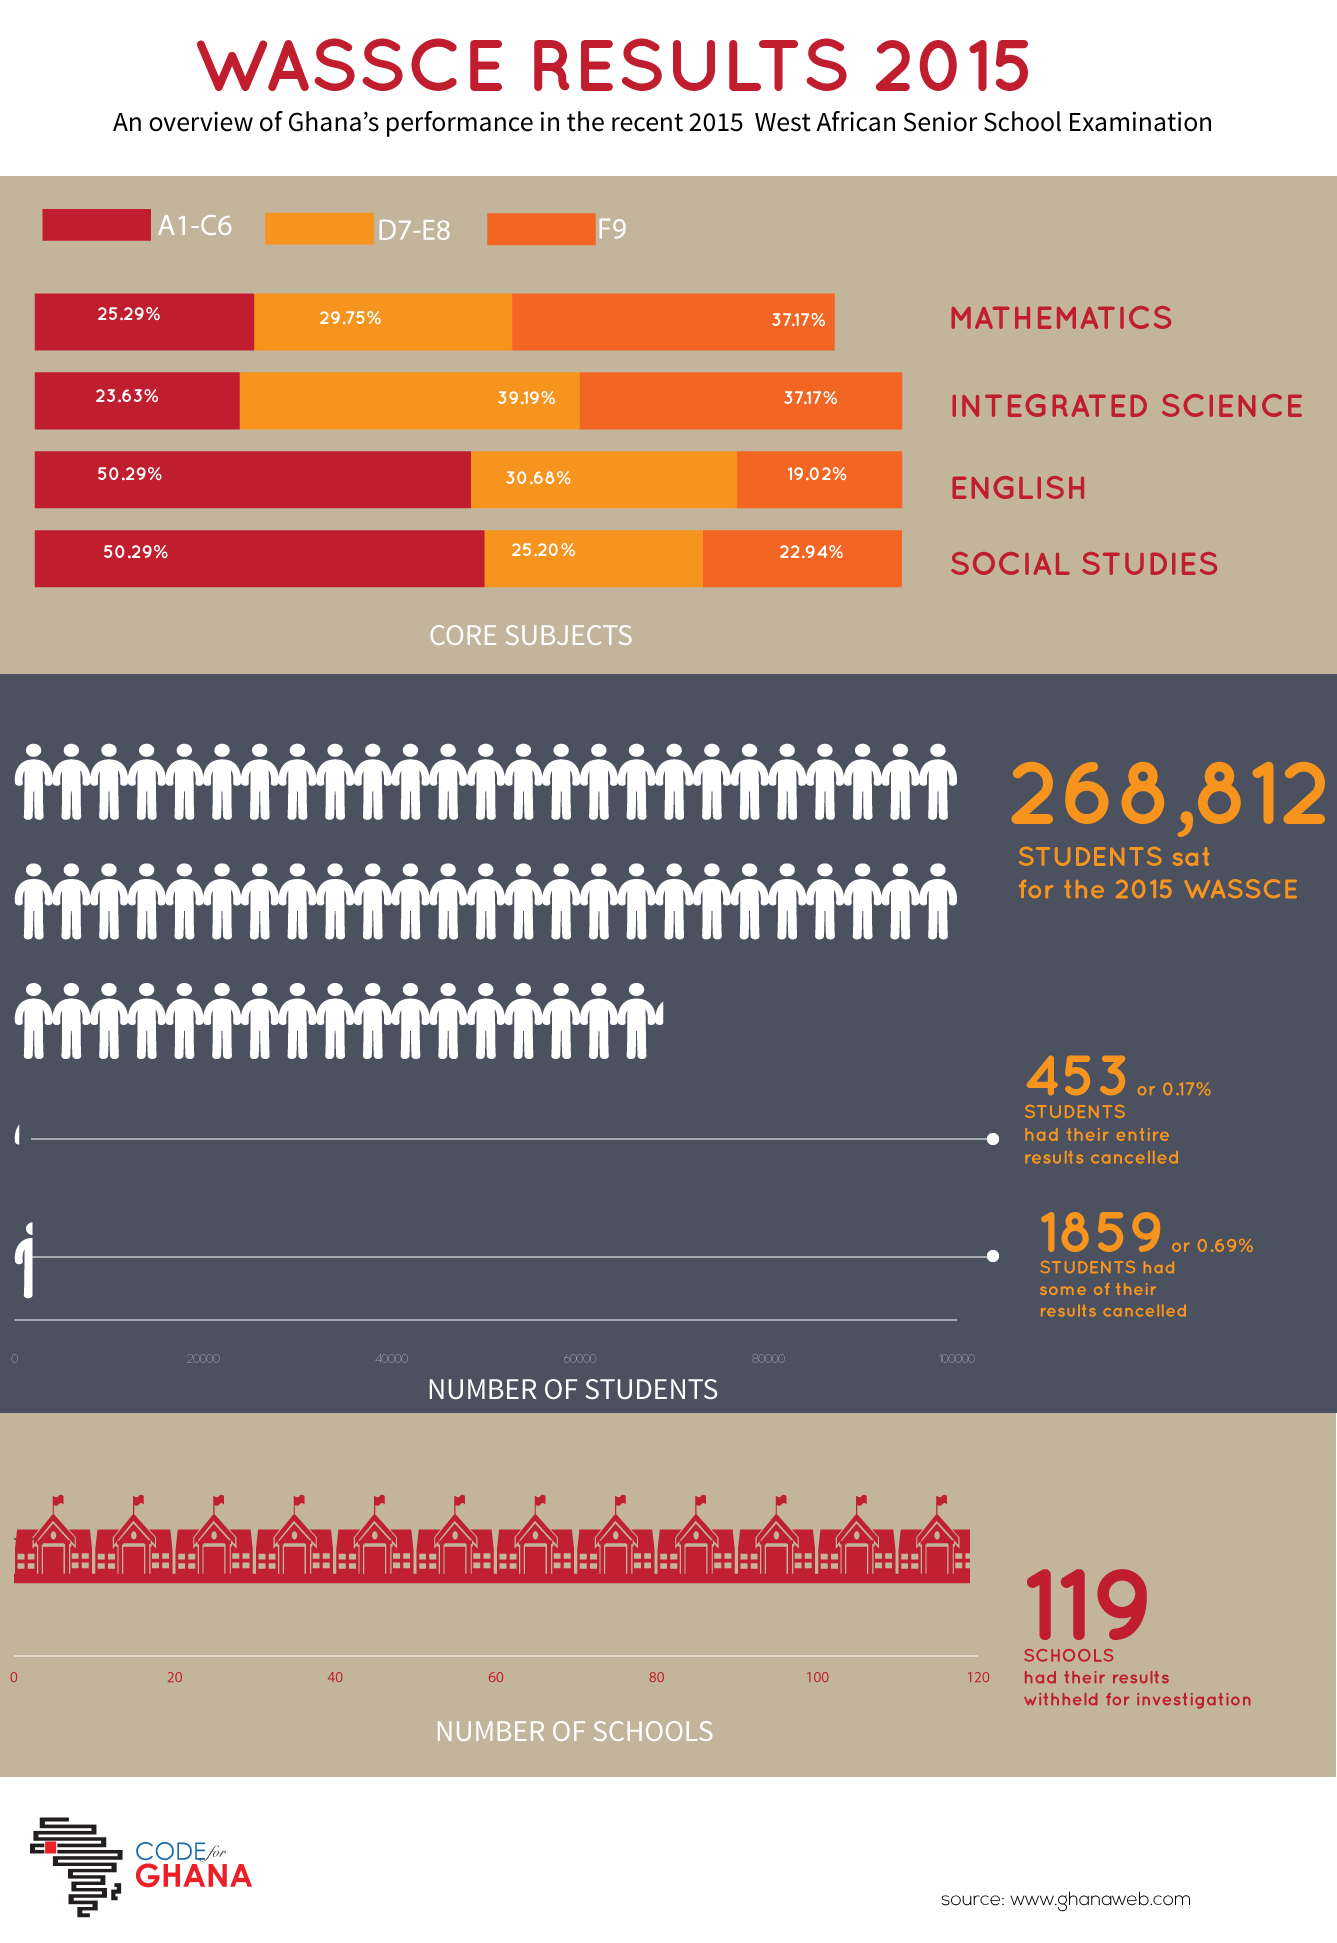
First of all, there has been a very significant increase in the number of candidates in one year. In 2014, 242,162 candidates sat for the exams, while 268, 812 sat for the exams this year (2015). These two figures indicate an 11% increase in WASSCE candidates over a one year period. A look at the performance of students in the core subjects (English, Mathematics, Social Studies and Integrated Science) also reveals a very interesting pattern this year. Whereas over 50% of the candidates had grades between A1 and C6 in English and Social Studies, about 25% and 23% had the same grade in Mathematics and Integrated Science respectively. This further exposes the historical poor performance of WASSCE candidates in Science and Mathematics.
Another interesting fact about the statistics is the high occurrence of irregularities in this year’s examination. These irregularities occurred in 2014 too; comparing the statistics from both years reveals that the situation has worsened in 2015. It is a common occurrence for some schools to have their results withheld for further investigations. In 2014 36 schools had their entire results withheld, in 2015 the results of 119 schools have been withheld. 321 students had their entire results cancelled in 2014, the figure is 453 for 2015. 1,994 candidates had some of their results cancelled in 2014, however in 2015, 1,859 candidates had some subject results cancelled. Also in 2015 8 students had their results cancelled and banned for 2 years from writing the examination.
The staggering statistics that came along with the release of the 2015 WASSCE results have been visualized in the infographic. There is a lot to be done. We hope the situation will not get any worse next year.