Overview of Ghana's GDP (2006 - 2014)

A country’s Gross Domestic Product refers to ‘the monetary value of all the finished goods and services produced within the borders of the country in a specific time period’. Though it is usually measured over a one-year period, it can be also be measured after six months.
GDP remains one of the best indications of a country’s economic growth or decline. However, there are some arguments against its reliability to reveal the actual economic state of a country. In the sense that, when a country’s GDP is high, it only translates into high standards of living once other factors are held constant. For example, if there is an equivalent growth in the population of a country as in its GDP - in the same period - this does not necessarily project a forthcoming high standard of living. Simply because, the equivalent growth in the population cancels out any positive effect the growth in the GDP might have on the citizens. Nevertheless, GDP is still used widely all over the world to measure and announce the economic state of a country.
The Ghanaian economy has not been in the best of shapes for some time now. This may be due to so many factors. However, that is not the focus for this post. We are looking at the GDP of Ghana between 2006 and 2014 and the contributions of the various sectors of the economy: Agriculture, Industry and Services. Below is an infographic representation of the various sectors of the economy, their various sub-sectors and how much they contributed to the entire economy in the year 2014.
######Major Sectors of Ghana’s Economy
The visualization above represents the major sectors of the Ghanaian economy. Taking a critical look at Ghana’s GDP in 2014, we can clearly see that the Services sector contributed benevolently; it contributed more greatly than the other sectors. The Services sector is made up of: Education, Information and Technology, Security, Health and Social Work, Financial and Insurance Activities etc. All these have been illustrated above. One may ask if the Services sector is therefore the greatest contributor to our economy? Well, looking at the GDP breakdown for one year is not good enough to reveal this to us. We would have to study the Ghanaian economy over a period of time to determine this fact. After closely studying the economy from 2006 to 2014, it revealed that the pattern has always been the same: the Services sector remains the greatest contributor to our economy. The services sector contributes close to half of the GDP for some years and for others, either exactly half or a little over that. In 2011, both the Industrial sector and the Agricultural sector contributed about 25% apiece to the GDP. Which also buttresses the point stated above: the Services sector in 2011, almost made a 50% contribution to the GDP. All these are also represented in the line graph below:
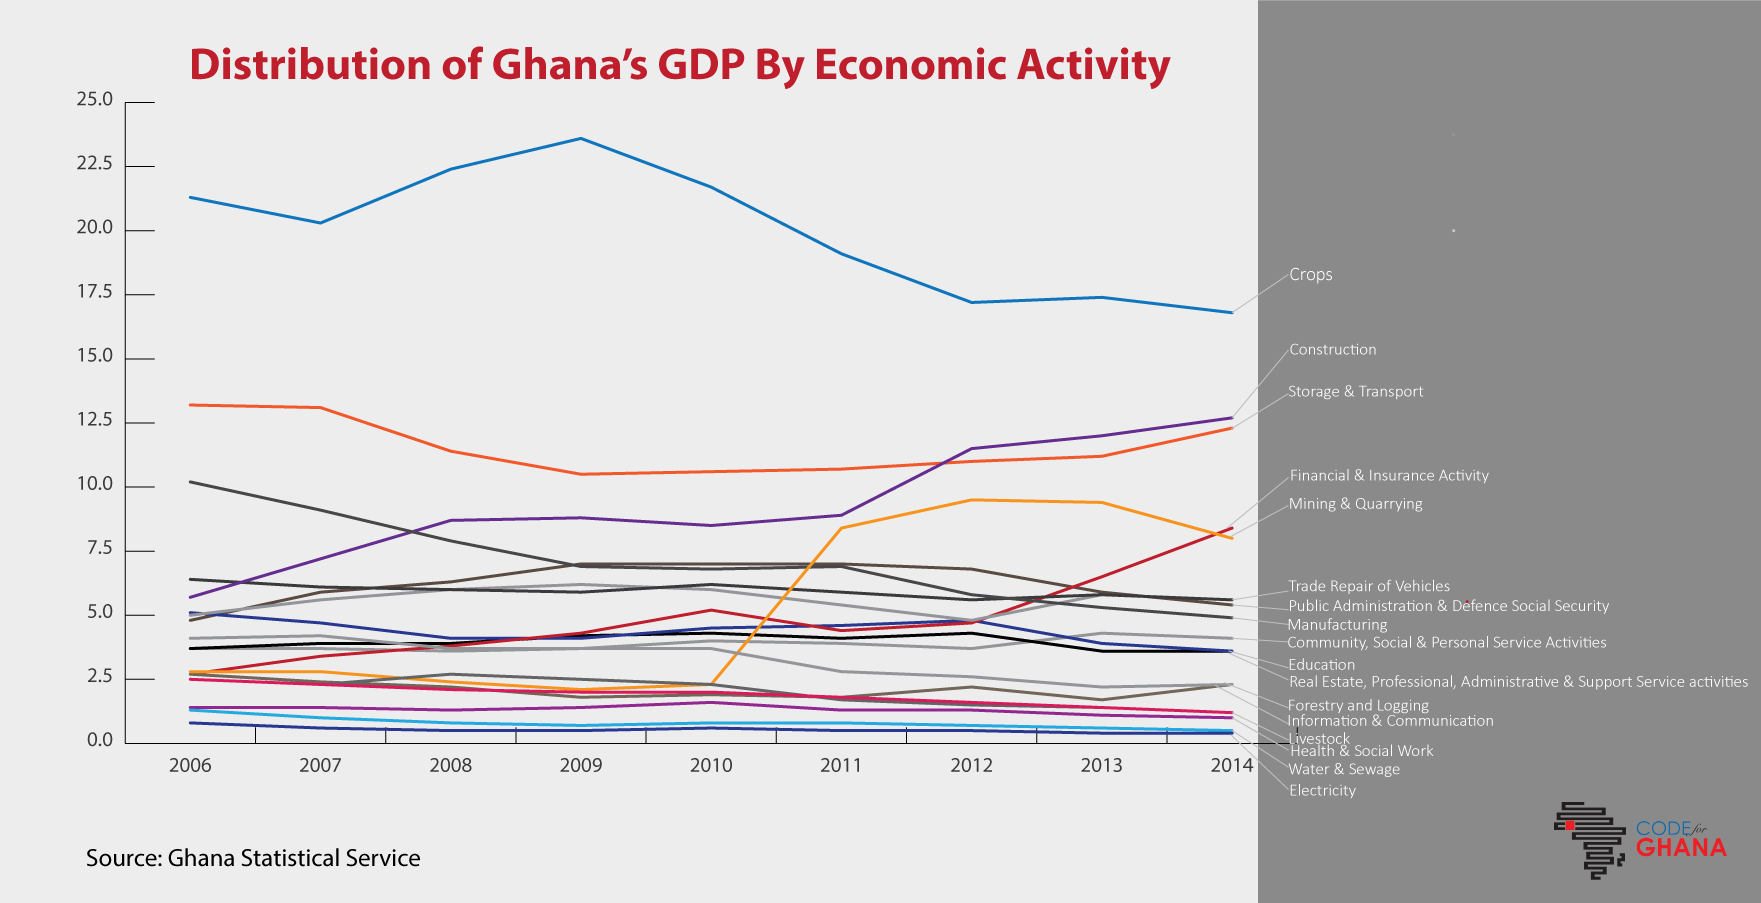
It has already been hinted above that there are several sub-sectors of each of the major sectors. The Services sector, being the greatest contributor to the GDP has the most sub-sectors. This is followed closely by the Industrial sector before the Agricultural sector. When the data is viewed from the angle of sub-sectors, it reveals a very interesting upset. Crops, which is under the Agricultural sector has been the greatest contributor to the country’s GDP between 2006 and 2014. This is surprising considering the fact that the Agric. sector’s contribution yearly to the GDP hovers around 20%. After Crops, the second highest contributing sub-sector is Transport and Storage, which is under the Services sector. This is also closely followed by Manufacturing (also under the Services Sector). A close look at the line graph below shows the steady rise of Construction, throughout the years to become the second highest contributing sub-sector in the Ghanaian economy in 2014. All these and more are revealed in the line graph below:
